Instrument


 , (*1)
With Instrument you can monitor and measure your PHP application performance. It can collect and store metrics such as script execution time and memory usage or time spent in database., (*2)
 , (*3)
Usage
Install using composer., (*4)
``` bash
$ composer require tuupola/instrument, (*5)
You also must have access to [InfluxDB](https://influxdata.com/) database to store the data. After installing connect to your database and start sending metrics.

``` php
require __DIR__ . "/vendor/autoload.php";

$influxdb = InfluxDB\Client::fromDSN("http+influxdb://user:pass@localhost:8086/instrument");
$instrument = new Instrument\Instrument([
    "adapter" => new Instrument\Adapter\InfluxDB($influxdb),
    "transformer" => new Instrument\Transformer\InfluxDB
]);

$instrument->count("users", 100);

$instrument->send();
Optionally if you want to use the gauge datatype you need the shmop extension and klaussilveira/simple-shm library., (*6)
composer require klaussilveira/simple-shm
There is also a companion middleware which can automate basic instrumenting of application code if you are using PSR-7 based framework., (*7)
Demo
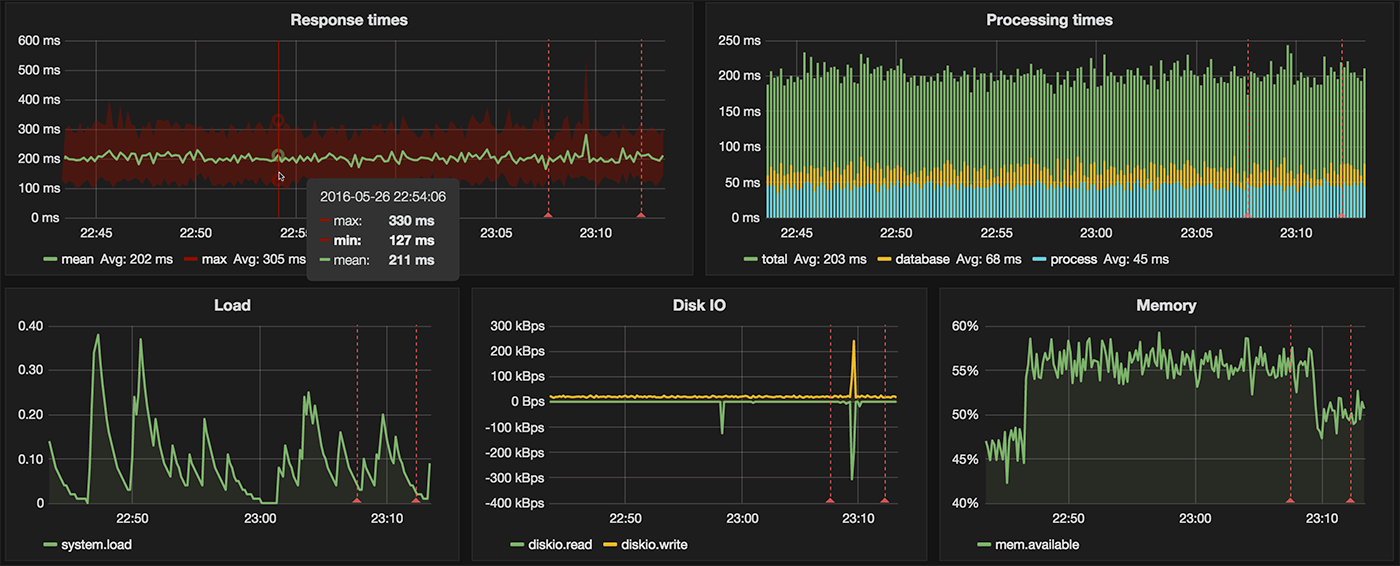
Example Grafana dashboard is included. To see Instrument in action start the Vagrant demo server and make some example requests., (*8)
``` bash
$ cd demo
$ vagrant up
$ while sleep 1; do curl http://192.168.50.53/random; done, (*9)
The above commands start the server and inserts random Instrument data every second.
You can now access the provided [demo dashboard](http://192.168.50.53:3000/dashboard/db/instrument) (admin:admin) to see this happening live.
## Writing data
Documentation assumes you have working knowledge of [InfluxDB data structures](https://docs.influxdata.com/influxdb/v1.0/concepts/key_concepts/). Each measurement must have a `name`. Measurements should contain either one `value` or several value `fields` or both. Optionally measurement can have one or more `tags`.
For example to create a new `count` measurement with name `users` with one value of `100` use either of the following.
``` php
$instrument->count("users", 100);
$instrument->count("users")->set(100);
$instrument->send();
> SELECT * FROM users
name: users
---------
time                  value
1457067288109133121    100
To log several values and additionally tag the measurement., (*10)
``` php
$instrument
->count("users")
->set("total", 100)
->set("active", 27)
->tags(["host" => "localhost"]);, (*11)
$instrument->send();, (*12)
SELECT * FROM users, (*13)
name: users
time total active host
1457067288109134122 100 27 localhost, (*14)
The event datatype does not contain numerical measurements.

``` php
$instrument
    ->event("deploy", "New version deployed")
    ->tags(["host" => "localhost"]);

$instrument->send();
> SELECT * FROM events;
name: events
------------
time                  title    description           host
1464277178854200406   deploy   New version deployed  localhost
Datatypes
Count
Count is the simplest datatype. In addition to setting the value you can also increment and decrement it., (*15)
$requests = $instrument->count("requests", 50); /* 50 */
$requests->increase(); /* 51 */
$requests->decrease(); /* 50 */
$requests->increase(5); /* 55 */

$instrument->send();
Or if you prefer fluent interfaces you can also do the following., (*16)
$instrument
  ->count("users")
  ->set("active", 27) /* 27 */
  ->increase("active", 5) /* 32 */
  ->decrease("active", 2); /* 30 */

$instrument->send();
Timing
With timing you can measure execution time in milliseconds. You can either pass the value yourself or use the provided helpers to measure code execution time., (*17)
$instrument->timing("roundtrip")->set("firstbyte", 28);
$instrument->timing("roundtrip")->set("lastbyte", 40);

$instrument->timing("roundtrip")->set("processing", function () {
    /* Code to be measured */
});

$instrument->timing("roundtrip")->start("fetching");
/* Code to be measured */
$instrument->timing("roundtrip")->stop("fetching");

$instrument->send();
Since timing internally uses symfony/stopwatch you can get PHP memory usage as a bonus. It is not automatically included in the measurement data, but you can include it manually., (*18)
$memory = $instrument->timing("roundtrip")->memory()
$instrument->timing("roundtrip")->set("memory", $memory);

$instrument->send();
Gauge
Gauge is same as count. However it remembers the value between requests. Gauge values are zeroed when server restarts. You need the shmop extension and klaussilveira/simple-shm to be able to use gauges., (*19)
$errors = $instrument->gauge("errors");
$errors->increase("fatal"); /* 1 */
$errors->increase("critical"); /* 1 */

unset($errors);

$errors = $instrument->gauge("errors");
$errors->increase("fatal"); /* 2 */
$errors->increase("critical", 4); /* 5 */

$instrument->send();
Single value can be deleted from shared memory with delete() method. All values of the named gauge can be deleted at once with clear() method., (*20)
$errors = $instrument->gauge("errors");
$errors->delete("fatal"); /* null */
$errors->clear();
Event
Events can be used to display annotations in your dashboard. By default they do not contain numerical measurements. Instead it contains title and description fields. These should contain a short name and longer description for the event., (*21)
``` php
$instrument
->event("deploy", "Version 0.9.0 deployed")
->tags(["host" => "localhost"]);, (*22)
$instrument
->event("deploy", "Version 0.9.1 deployed")
->tags(["host" => "localhost"]);, (*23)
$instrument->send();, (*24)
SELECT * FROM events;, (*25)
name: events
time title description host
1464277178854200406 deploy Version 0.9.0 deployed localhost
1464277178854201240 deploy Version 0.9.1 deployed localhost, (*26)
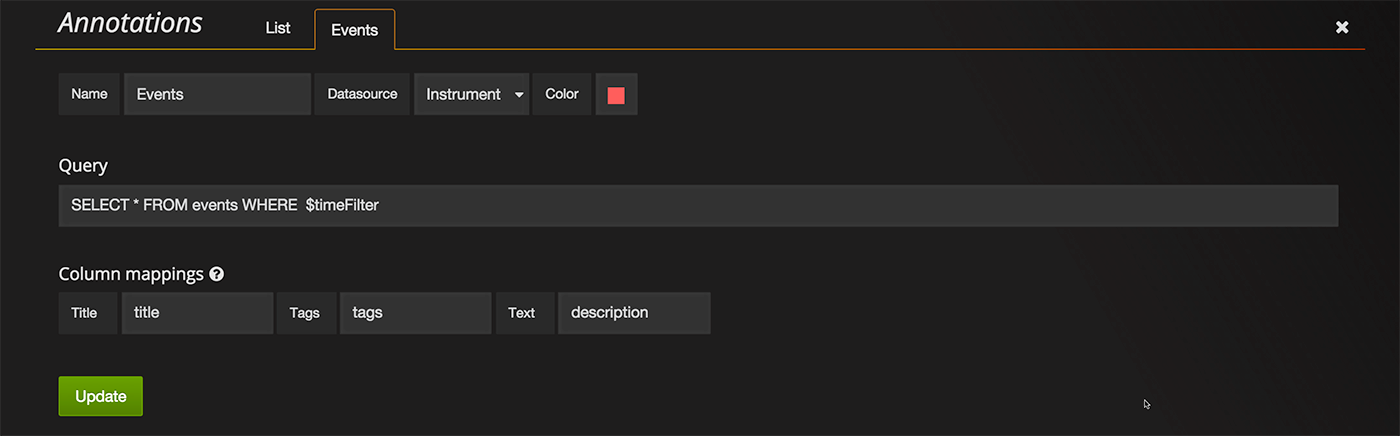
If you are using Grafana you can use above data by using `SELECT * FROM events WHERE $timeFilter` as the annotation query. Also set the column mappings as shown below.
## Testing
You can run tests either manually...
``` bash
$ composer test
... or automatically on every code change. This requires entr to work., (*27)
bash
$ composer watch
, (*28)
Contributing
Please see CONTRIBUTING for details., (*29)
Security
If you discover any security related issues, please email tuupola@appelsiini.net instead of using the issue tracker., (*30)
License
The MIT License (MIT). Please see License File for more information., (*31)
 Wallogit.com
