Charts
Charts is a multi-library chart package to create interactive charts using laravel.


 , (*1)
 , (*2)
Table Of Contents
Installation
Video Tutorial
 , (*3)
To install charts use composer, (*4)
Download
composer require hilioski/charts
Add service provider & alias
Add the following service provider to the array in: config/app.php, (*5)
ConsoleTVs\Charts\ChartsServiceProvider::class,
Add the following alias to the array in: config/app.php, (*6)
'Charts' => ConsoleTVs\Charts\Charts::class,
Publish the assets
php artisan vendor:publish --tag=charts_config
php artisan vendor:publish --tag=charts_assets --force
Default Settings
The file in: config/charts.php contains an array of settings, you can find the default settings in there., (*7)
Example Usage
Example Controller:, (*8)
setTitle('My nice chart')
->setLabels(['First', 'Second', 'Third'])
->setValues([5,10,20])
->setDimensions(1000,500)
->setResponsive(false);
return view('test', ['chart' => $chart]);
}
}
```
Example View:
```html
My Charts
{!! Charts::assets() !!}
{!! $chart->render() !!}
```
## Create Charts
| Create Charts | line | area | bar | pie | donut | geo | gauge | temp | percentage | progressbar |
|---------------|------|------|-----|-----|-------|-----|-------|------|------------|-------------|
| chartjs | x | x | x | x | x | - | - | - | - | - |
| highcharts | x | x | x | x | x | x | - | - | - | - |
| google | x | x | x | x | x | x | x | - | - | - |
| material | x | - | x | - | - | - | - | - | - | - |
| chartist | x | x | x | x | x | - | - | - | - | - |
| fusioncharts | x | x | x | x | x | - | - | - | - | - |
| morris | x | x | x | - | x | - | - | - | - | - |
| plottablejs | x | x | x | x | x | - | - | - | - | - |
| minimalist | x | x | x | x | x | - | - | - | - | - |
| canvas-gauges | - | - | - | - | - | - | x | x | - | - |
| justgage | - | - | - | - | - | - | x | - | x | - |
| progressbarjs | - | - | - | - | - | - | - | - | x | x |
The first argument of the create method is the chart type, and the second is the library
```php
Charts::create('line', 'highcharts')
->setTitle('My nice chart')
->setLabels(['First', 'Second', 'Third'])
->setValues([5,10,20])
->setDimensions(1000,500)
->setResponsive(false);
```
## Multi Datasets Chart
| Multi Dataset Charts | line | area | bar | pie | donut | geo | gauge | temp | percentage | progressbar |
|----------------------|------|------|-----|-----|-------|-----|-------|------|------------|-------------|
| chartjs | x | x | x | - | - | - | - | - | - | - |
| highcharts | x | x | x | - | - | - | - | - | - | - |
| google | x | x | x | - | - | - | - | - | - | - |
| material | x | - | x | - | - | - | - | - | - | - |
| chartist | x | x | x | - | - | - | - | - | - | - |
| fusioncharts | x | x | x | - | - | - | - | - | - | - |
| morris | x | x | x | - | - | - | - | - | - | - |
| plottablejs | x | x | x | - | - | - | - | - | - | - |
| minimalist | x | x | x | - | - | - | - | - | - | - |
| canvas-gauges | - | - | - | - | - | - | - | - | - | - |
| justgage | - | - | - | - | - | - | - | - | - | - |
| progressbarjs | - | - | - | - | - | - | - | - | - | - |
To create multi-dataset charts simply add the values using the ```setDataset()``` function!
```php
Charts::multi('line', 'highcharts')
->setColors(['#ff0000', '#00ff00', '#0000ff'])
->setLabels(['One', 'Two', 'Three'])
->setDataset('Test 1', [1,2,3])
->setDataset('Test 2', [0,6,0])
->setDataset('Test 3', [3,4,1]);
```
- setDataset(required string $element_label, required array $values)
```php
Charts::multi('bar', 'minimalist')
->setResponsive(false)
->setDimensions(0, 500)
->setColors(['#ff0000', '#00ff00', '#0000ff'])
->setLabels(['One', 'Two', 'Three'])
->setDataset('Test 1', [1,2,3])
->setDataset('Test 2', [0,6,0])
->setDataset('Test 3', [3,4,1]);
```
## Database Charts
You can also generate database charts with simple setup!
```php
$chart = Charts::database(User::all(), 'bar', 'highcharts');
```
Example data:

**Note:** You are required to use a specific group method before rendering the chart!
*Important:* To work with the *GroupByYear, GroupByMonth, GroupByDay, lastByYear, lastByMonth & lastByDay* you'll need the column ```created_at``` in the data rows.
The available methods are:
- setData(required mixed $data)
Setup the data again.
```php
$chart = Charts::database(User::all(), 'bar', 'highcharts')->setData(Role::all());
```
- setDateColumn(required string $column)
Set the column to group the data.
*Default:* ```created_at```
```php
$chart = Charts::database(User::all(), 'bar', 'highcharts')->setDateColumn('my_date_column');
```
- setDateFormat(required string $format)
Set the fancy date format for `groupByDay()` and `lastByDay()` function if `$fancy` set to true, must be called before those function.
*Default:* ```l dS M, Y```
```php
$chart = Charts::database(User::all(), 'bar', 'highcharts')->setDateFormat('j F y');
```
- setMonthFormat(required string $format)
Set the fancy date format for `groupByMonth()` and `lastByMonth()` function if `$fancy` set to true, must be called before those function.
*Default:* ```F, Y```
```php
$chart = Charts::database(User::all(), 'bar', 'highcharts')->setDateFormat('F Y');
```
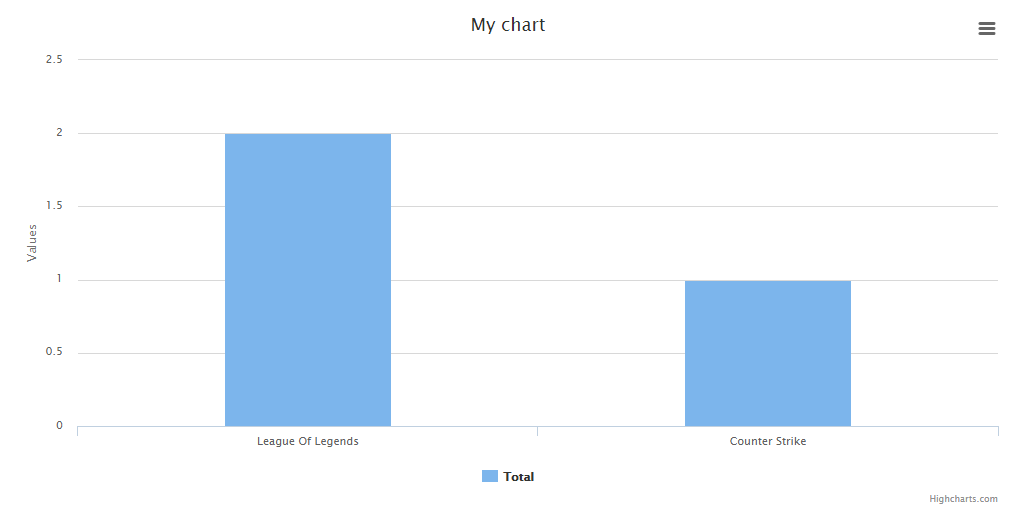
- groupBy(required string $column)
Groups the data based on a column.
```php
$chart = Charts::database(User::all(), 'bar', 'highcharts')
->setElementLabel("Total")
->setDimensions(1000, 500)
->setResponsive(false)
->groupBy('game');
```
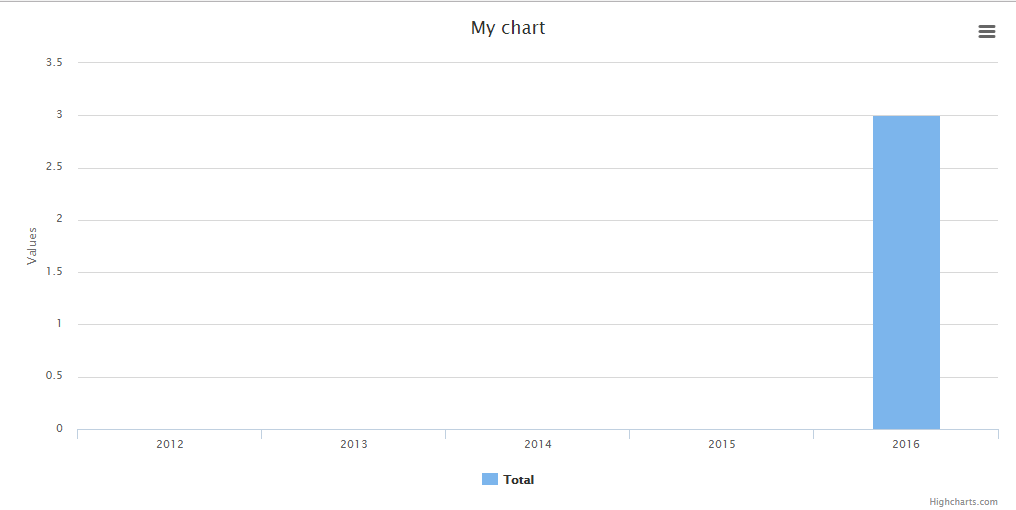
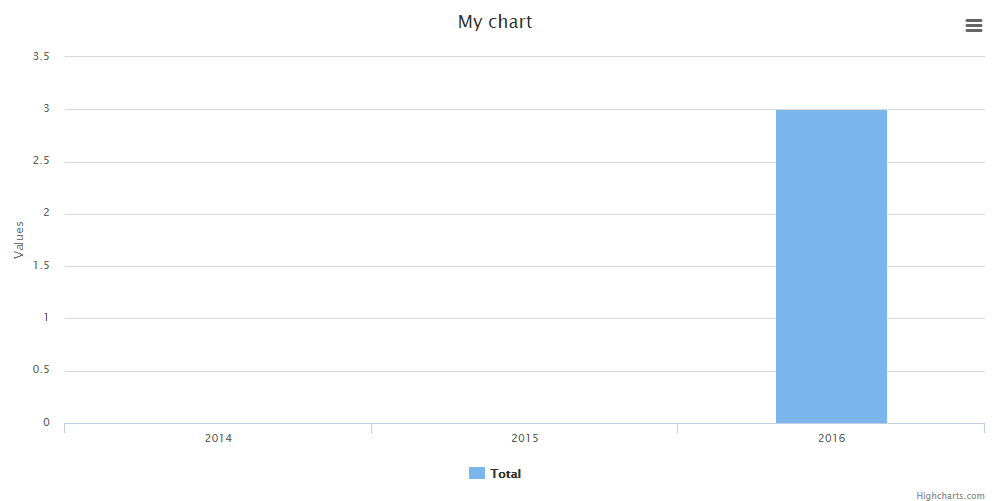
- groupByYear(optional int $years)
Groups the data based in years.
*Default:* ```$years = 4```
```php
$chart = Charts::database(User::all(), 'bar', 'highcharts')
->setElementLabel("Total")
->setDimensions(1000, 500)
->setResponsive(false)
->groupByYear();
// to display a number of years behind, pass a int parameter. For example to display the last 10 years:
$chart = Charts::database(User::all(), 'bar', 'highcharts')
->setElementLabel("Total")
->setDimensions(1000, 500)
->setResponsive(false)
->groupByYear(10);
```
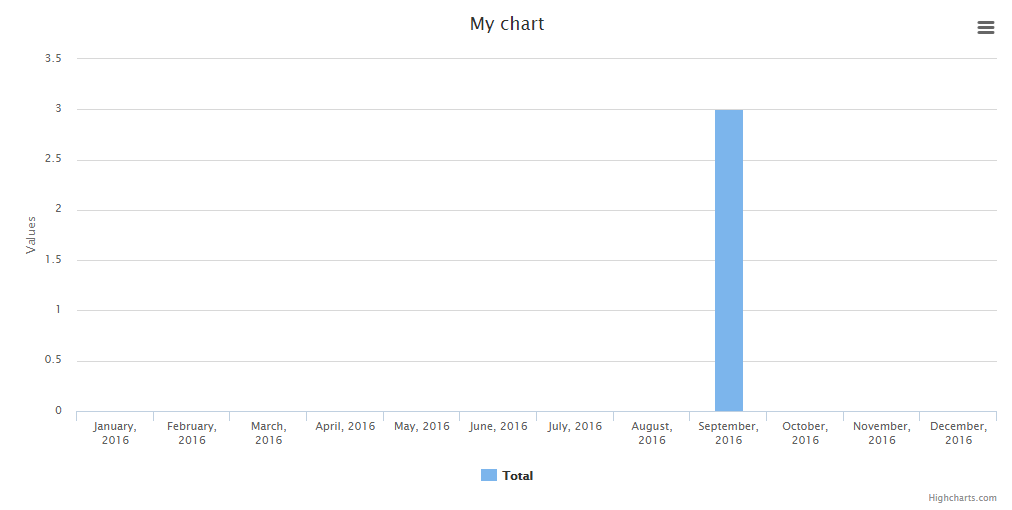
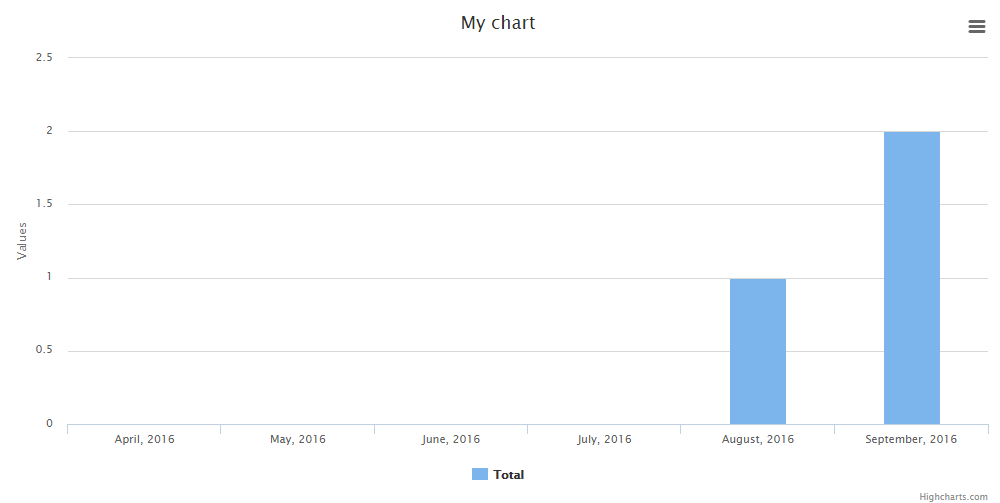
- groupByMonth(optional string $year, optional boolean $fancy)
Groups the data in months (if no year set, the current one will be used).
*Default:* ```$year = 7, $fancy = false```
```php
$chart = Charts::database(User::all(), 'bar', 'highcharts')
->setElementLabel("Total")
->setDimensions(1000, 500)
->setResponsive(false)
->groupByMonth();
// to display a specific year, pass the parameter. For example to display the months of 2016 and display a fancy output label:
$chart = Charts::database(User::all(), 'bar', 'highcharts')
->setElementLabel("Total")
->setDimensions(1000, 500)
->setResponsive(false)
->groupByMonth('2016', true);
```
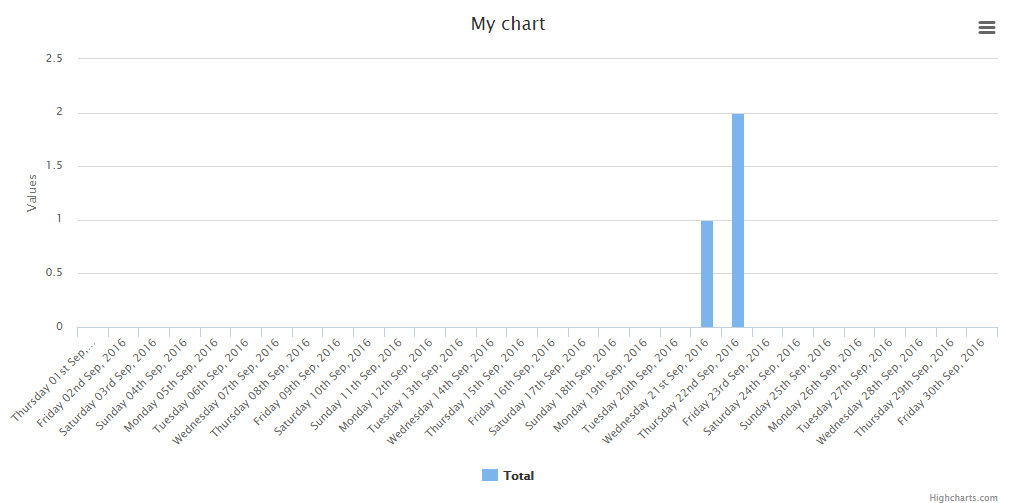
- groupByDay(optional string $month, optional string $year, optional boolean $fancy)
Groups the data in days (if no year/month set, the current one will be used).
*Default:* ```$month = date('m'), $year = date('Y'), $fancy = false```
```php
$chart = Charts::database(User::all(), 'bar', 'highcharts')
->setElementLabel("Total")
->setDimensions(1000, 500)
->setResponsive(false)
->groupByDay();
// to display a specific month and/or year, pass the parameters. For example to display the days of september 2016 and display a fancy output label:
$chart = Charts::database(User::all(), 'bar', 'highcharts')
->setElementLabel("Total")
->setDimensions(1000, 500)
->setResponsive(false)
->groupByDay('09', '2016', true);
```
- lastByYear(optional int $number)
Alias for groupByYear() method. Does the same.
*Default:* ```$number = 4```
```php
$chart = Charts::database(User::all(), 'bar', 'highcharts')
->setElementLabel("Total")
->setDimensions(1000, 500)
->setResponsive(false)
->lastByYear();
// to display a number of years behind, pass a int parameter. For example to display the last 3 years:
$chart = Charts::database(User::all(), 'bar', 'highcharts')
->setElementLabel("Total")
->setDimensions(1000, 500)
->setResponsive(false)
->lastByYear(3);
```
- lastByMonth(optional int $number, optional boolean $fancy)
Display the numbers of months behind (relative to the current date).
*Default:* ```$number = 6, $fancy = false```
```php
$chart = Charts::database(User::all(), 'bar', 'highcharts')
->setElementLabel("Total")
->setDimensions(1000, 500)
->setResponsive(false)
->lastByMonth();
// to display a number of months behind, pass a int parameter. For example to display the last 6 months and use a fancy output:
$chart = Charts::database(User::all(), 'bar', 'highcharts')
->setElementLabel("Total")
->setDimensions(1000, 500)
->setResponsive(false)
->lastByMonth(6, true);
```
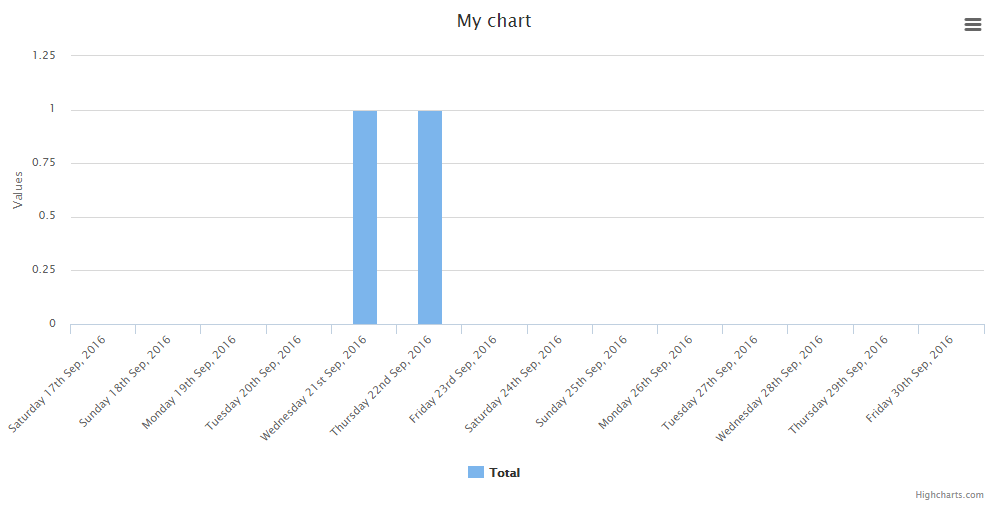
- lastByDay(optional int $number, optional boolean $fancy)
Display the numbers of days behind (relative to the current date).
*Default:* ```$number = 7, $fancy = false```
```php
$chart = Charts::database(User::all(), 'bar', 'highcharts')
->setElementLabel("Total")
->setDimensions(1000, 500)
->setResponsive(false)
->lastByDay();
// to display a number of days behind, pass a int parameter. For example to display the last 14 days and use a fancy output:
$chart = Charts::database(User::all(), 'bar', 'highcharts')
->setElementLabel("Total")
->setDimensions(1000, 500)
->setResponsive(false)
->lastByDay(14, true);
```
## Realtime Charts
| Realtime Charts | line | area | bar | pie | donut | geo | gauge | temp | percentage | progressbar |
|-----------------|------|------|-----|-----|-------|-----|-------|------|------------|-------------|
| chartjs | - | - | - | - | - | - | - | - | - | - |
| highcharts | x | x | x | - | - | - | - | - | - | - |
| google | - | - | - | - | - | - | x | - | - | - |
| material | - | - | - | - | - | - | - | - | - | - |
| chartist | - | - | - | - | - | - | - | - | - | - |
| fusioncharts | - | - | - | - | - | - | - | - | - | - |
| morris | - | - | - | - | - | - | - | - | - | - |
| plottablejs | - | - | - | - | - | - | - | - | - | - |
| minimalist | - | - | - | - | - | - | - | - | - | - |
| canvas-gauges | - | - | - | - | - | - | x | x | - | - |
| justgage | - | - | - | - | - | - | x | - | x | - |
| progressbarjs | - | - | - | - | - | - | - | - | x | x |
You can create realtime charts.
Example json:
```json
{"value":31}
```
'value' can be changed to diferent index name with ```setValueName($string)```
```php
$chart = Charts::realtime(url('/path/to/json'), 2000, 'gauge', 'google')
->setValues([65, 0, 100])
->setLabels(['First', 'Second', 'Third'])
->setResponsive(false)
->setHeight(300)
->setWidth(0)
->setTitle("Permissions Chart")
->setValueName('value'); //This determines the json index for the value
```
**Note:** The interval is set in ms
The available methods are:
- setValueName(required string $string)
Sets the value json index.
*Default:* ```value```
```php
$chart = Charts::realtime(url('/path/to/json'), 2000, 'gauge', 'google')
->setValues([65, 0, 100])
->setLabels(['First', 'Second', 'Third'])
->setResponsive(false)
->setHeight(300)
->setWidth(0)
->setTitle("Permissions Chart")
->setValueName('value'); //This determines the json index for the value
```
- setUrl(required string $url)
Sets the url after chart object creation.
```php
$chart = Charts::realtime(url('/path/to/json'), 2000, 'gauge', 'google')
->setValues([65, 0, 100])
->setLabels(['First', 'Second', 'Third'])
->setResponsive(false)
->setHeight(300)
->setWidth(0)
->setTitle("Permissions Chart")
->setUrl(url('/new/json'));
```
- setInterval(required int $interval)
Sets the interval after chart object creation (ms).
```php
$chart = Charts::realtime(url('/path/to/json'), 2000, 'gauge', 'google')
->setValues([65, 0, 100])
->setLabels(['First', 'Second', 'Third'])
->setResponsive(false)
->setHeight(300)
->setWidth(0)
->setTitle("Permissions Chart")
->setInterval(3000); // in ms
```
- setMaxValues(required int $number)
Sets the max ammount of values to be seen before removing the first one.
```php
$chart = Charts::realtime(url('/path/to/json'), 1000, 'area', 'highcharts')
->setResponsive(false)
->setHeight(300)
->setWidth(0)
->setTitle("Permissions Chart")
->setMaxValues(10);
```
## Math Functions Charts
You can create math function charts.
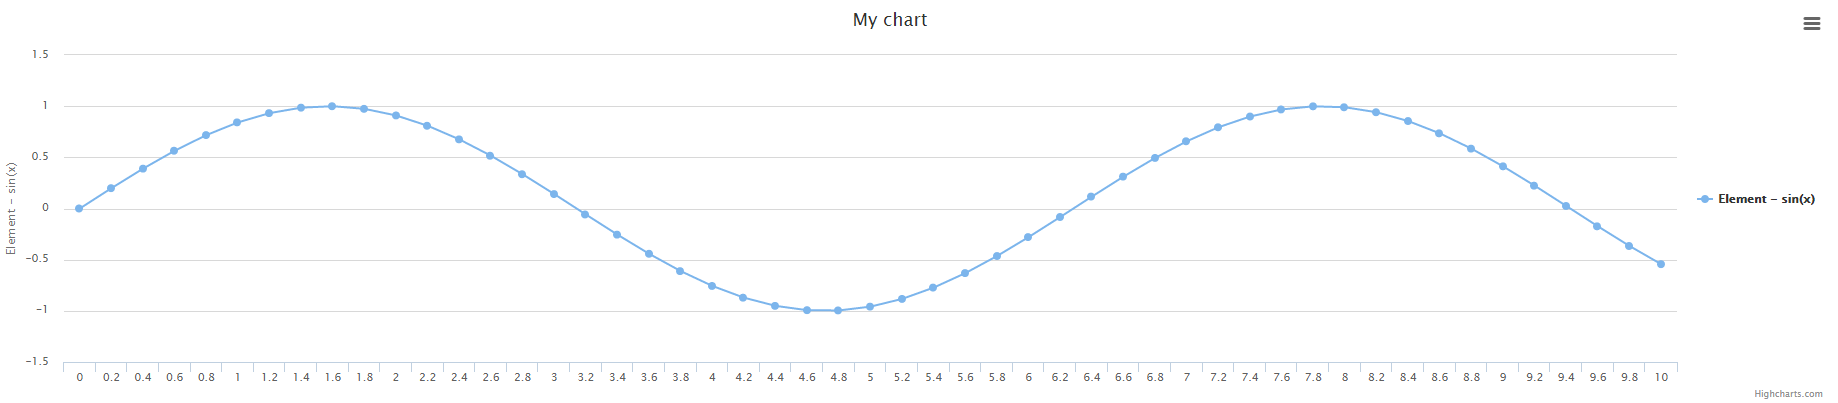
```php
Charts::math('sin(x)', [0, 10], 0.2, 'line', 'highcharts');
```
The function is ```sin(x)```, the interval is ```[0, 10]``` and the ```x``` amplitude is ```0.2```
- setFunction(required string $function)
Sets the function.
```php
Charts::math('sin(x)', [0, 10], 0.2, 'line', 'highcharts')->setFunction('x+1');
```
- setInterval(required array $interval)
Sets the function / chart interval.
```php
Charts::math('sin(x)', [0, 10], 0.2, 'line', 'highcharts')->setInterval([2, 8]);
```
- setAmplitude(required int $amplitude)
Sets the function amplitude between x points.
```php
Charts::math('sin(x)', [0, 10], 0.2, 'line', 'highcharts')->setAmplitude(0.5);
```
- calculate()
Calculates the valeus / labels for the chart.
**Note:** This function is called every time a modification is made in the chart function, interval or amplitude
so you don't need to call it every time you change the values. It's just an auxiliary function.
```php
Charts::math('sin(x)', [0, 10], 0.2, 'line', 'highcharts')->calculate();
```
## Charts Functions
- create(optional string $type, optional string $library)
Returns a new chart instance, if no library is specified, the default one will be used.
```php
Charts::create('line');
Charts::create('line', 'highcharts');
```
- database(required mixed $object, optional string $type, optional string $library)
Returns a new database chart instance that extends the base one.
```php
Charts::database(User::all());
Charts::create(User::all(), 'line', 'highcharts');
```
- realtime(required string $url, required int $interval, optional string $type, optional string $library)
Returns a new database chart instance that extends the base one.
```php
Charts::realtime(url('/json/data'), 2000, 'gauge', 'google')
```
- realtime(required string $function, required array $interval, required int $amplitude, optional string $type, optional string $library)
Returns a new math function chart instance that extends the base one.
```php
Charts::math('sin(x)', [0, 10], 0.2, 'line', 'highcharts');
```
- assets(optional array $libraries)
Returns all the assets to generate the graphs.
To output only certain libraries, add an array to it with the libraries you want
```php
// Using blade
{!! Charts::assets() !!}
// Only certain libraries
{!! Charts::assets(['google', 'chartjs']) !!}
```
- libraries(optional string $type)
Returns an array of all the libraries available (can be filtered).
```php
// Return all the libraries available
print_r(Charts::libraries());
// Return all the libraries available for the line chart
print_r(Charts::libraries('line'));
```
- types(optional string $library)
Returns an array of all the chart types available (can be filtered).
```php
// Return all the chart types available
print_r(Charts::types());
// Return all the chart types available for the highcharts library
print_r(Charts::libraries('highcharts'));
```
## Available Chart Settings:
- setGaugeStyle(required string $style)
Set the gauge style
*Default:* ```left```
*Available options:* ```left``` ```right``` ```center```
```php
Charts::create('gauge', 'google')->setGaugeStyle('right');
```
- setType(required string $type)
Set the chart type after creation (Example: from line to pie).
```php
Charts::create('line', 'highcharts')->setType('pie');
```
- setLibrary(required string $library)
Set the chart library after creation (Example: from highcharts to google).
```php
Charts::create('line', 'highcharts')->setLibrary('google');
```
- setLabels(required array $labels)
The labels of the chart.
```php
Charts::create('line', 'highcharts')->setLabels(['First', 'Second', 'Third']);
```
- setValues(required array $values)
The values of the chart respectively.
```php
Charts::create('line', 'highcharts')->setValues([10, 50, 100]);
```
- setElementLabel(required string $element_label)
The element label for line / bar / geo charts.
```php
Charts::create('line', 'highcharts')->setElementLabel('Total Views');
```
- setTitle(required string $title)
The chart title.
```php
Charts::create('line', 'highcharts')->setTitle('My Chart');
```
- setColors(required array $colors)
The colors of the charts respectively.
```php
Charts::create('line', 'highcharts')->setColors(['#ff0000', '#00ff00', '#0000ff']);
```
- setWidth(required int $width)
The chart width if non-responsive. 0 = responsive width.
```php
Charts::create('line', 'highcharts')->setWidth(1000);
```
- setHeight(required int $height)
The chart height if non-responsive. 0 = responsive height.
```php
Charts::create('line', 'highcharts')->setHeight(500);
```
- setDimensions(required int $width, required int $height)
The chart dimensions (shortcut to set width, height with one funcion).
```php
Charts::create('line', 'highcharts')->setHeight(1000, 500);
```
- setResponsive(required boolean $responsive)
Set if the chart is responsive or not. If not, the chart dimensions will be used.
```php
Charts::create('line', 'highcharts')->setResponsive(false);
```
- settings()
Return the chart settings.
```php
print_r(Charts::create('line', 'highcharts')->settings());
```
- render()
Render the chat.
```php
echo Charts::create('line', 'highcharts')->setLabels(['One', 'Two'])->setValues([10, 20])->render();
```
## Chart Examples
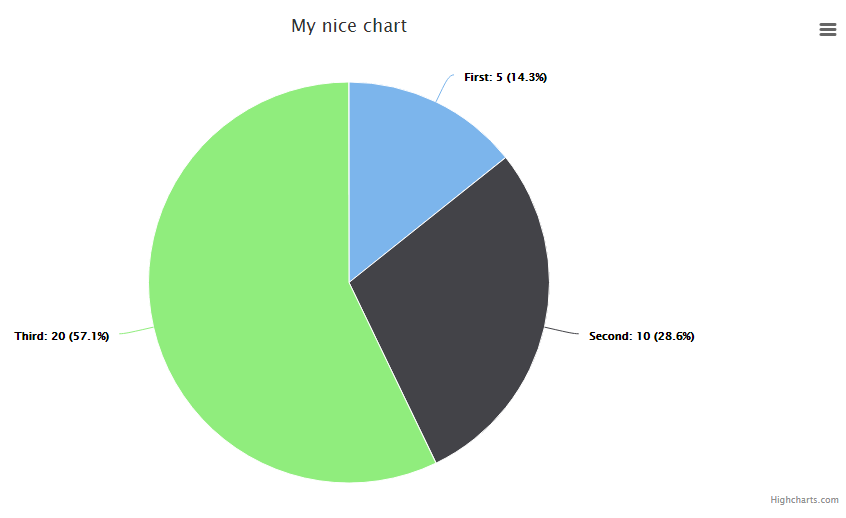
### Pie
Note: ```highcharts``` can't change the color of this chart. Well it can but it's complicated, so I leave it here.
```php
Charts::create('pie', 'highcharts')
->setTitle('My nice chart')
->setLabels(['First', 'Second', 'Third'])
->setValues([5,10,20])
->setDimensions(1000,500)
->setResponsive(false);
```
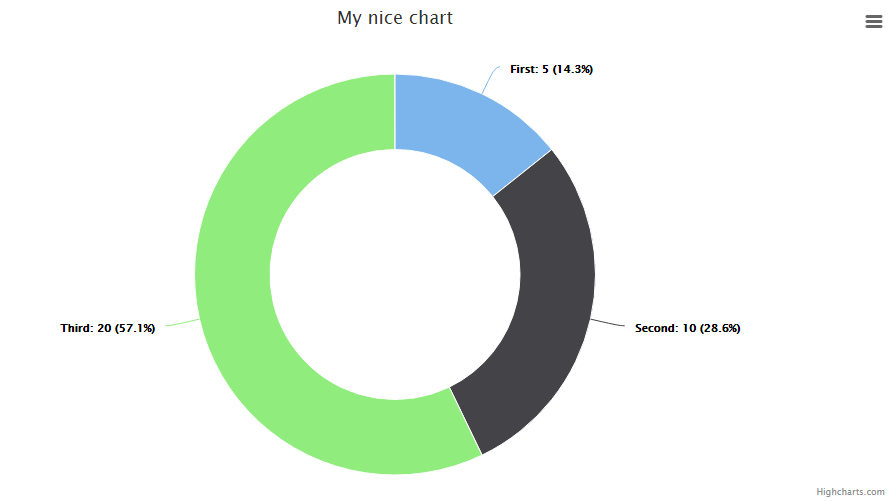
### Donut / Doughnut
Note: ```highcharts``` and ```chartist``` can't change the color of this chart. Well they can but it's complicated, so I leave it here.
```php
Charts::create('donut', 'highcharts')
->setTitle('My nice chart')
->setLabels(['First', 'Second', 'Third'])
->setValues([5,10,20])
->setDimensions(1000,500)
->setResponsive(false);
```
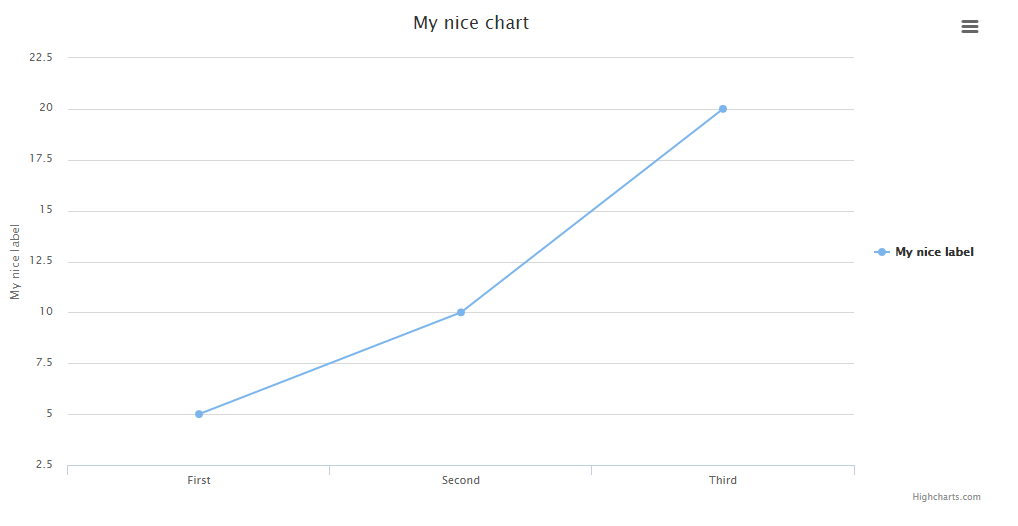
### Line
```php
Charts::create('line', 'highcharts')
->setTitle('My nice chart')
->setElementLabel('My nice label')
->setLabels(['First', 'Second', 'Third'])
->setValues([5,10,20])
->setDimensions(1000,500)
->setResponsive(false);
```
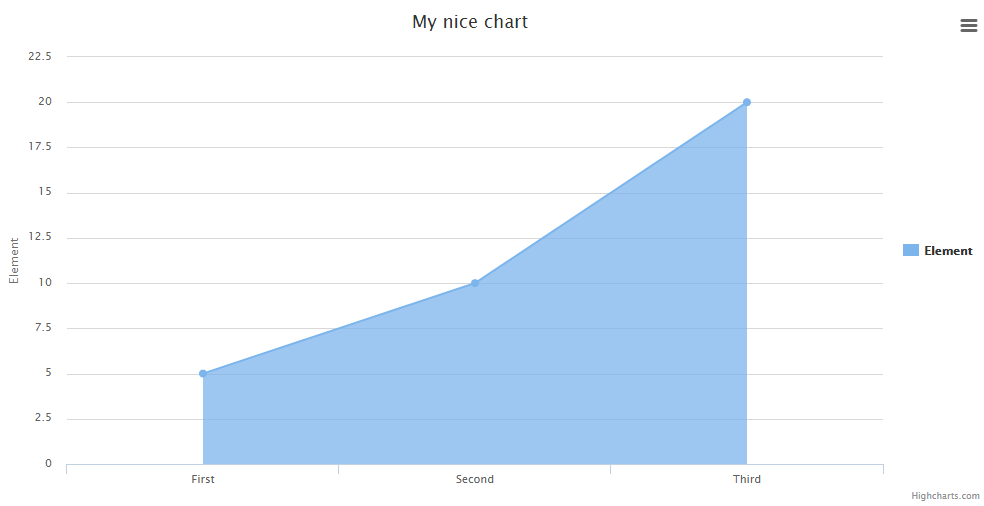
### Area
```php
Charts::create('area', 'highcharts')
->setTitle('My nice chart')
->setElementLabel('My nice label')
->setLabels(['First', 'Second', 'Third'])
->setValues([5,10,20])
->setDimensions(1000,500)
->setResponsive(false);
```
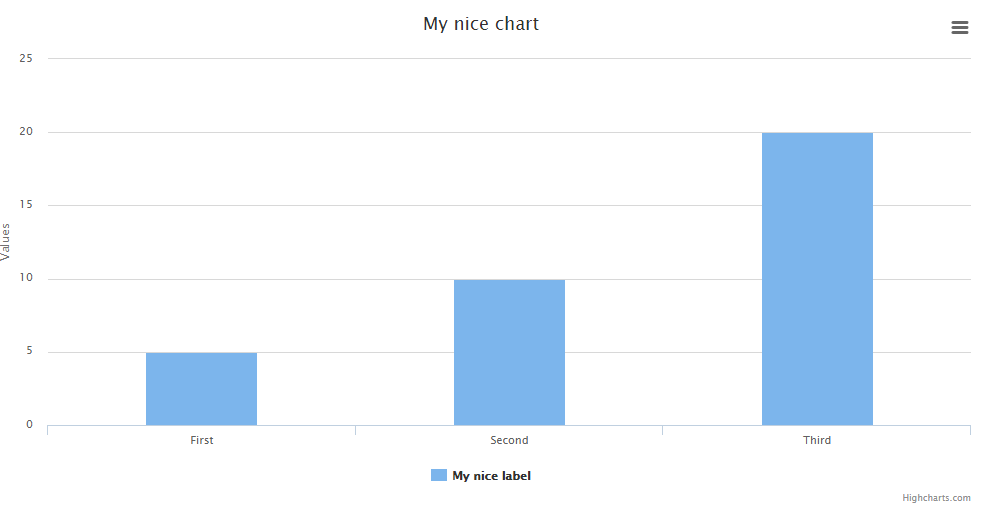
### Bar
Note: ```highcharts``` can't change the color of this chart. Well it can but it's complicated, so I leave it here.
```php
Charts::create('bar', 'highcharts')
->setTitle('My nice chart')
->setElementLabel('My nice label')
->setLabels(['First', 'Second', 'Third'])
->setValues([5,10,20])
->setDimensions(1000,500)
->setResponsive(false);
```
### ColorBar
Note: ```colorbar``` not include element label legend.
```php
Charts::create('colorbar', 'highcharts')
->setTitle('My nice colorful chart')
->setColors(['#e04f67', '#7cb5ec'])
->setLabels(['First', 'Second'])
->setValues([5,10])
->setDimensions(200,200)
->setResponsive(false);
```

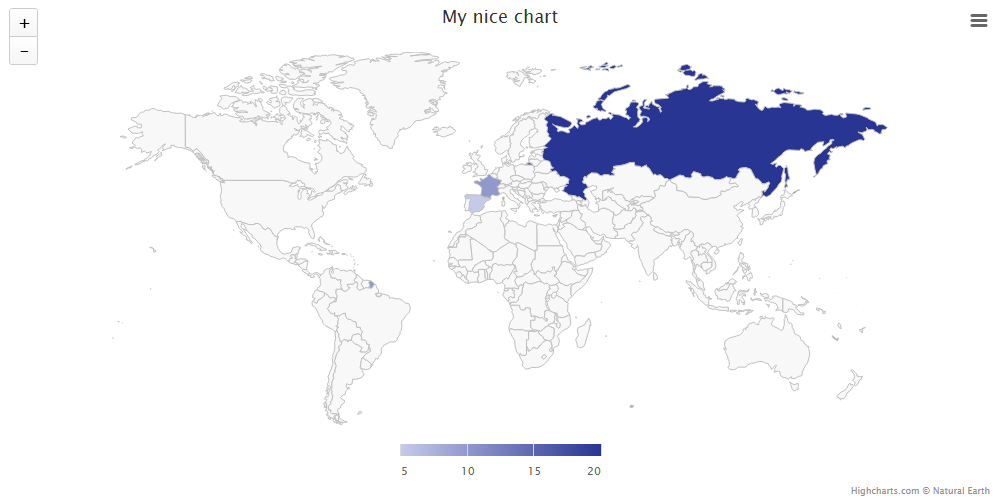
### Geo
Note: The labels must have the country codes, not the name.
Note 2: To add color to the chart, you'll need to provide an array of at least 2 colors. The first is the min and the second the max.
```php
Charts::create('geo', 'highcharts')
->setTitle('My nice chart')
->setElementLabel('My nice label')
->setLabels(['ES', 'FR', 'RU'])
->setColors(['#C5CAE9', '#283593'])
->setValues([5,10,20])
->setDimensions(1000,500)
->setResponsive(false);
```
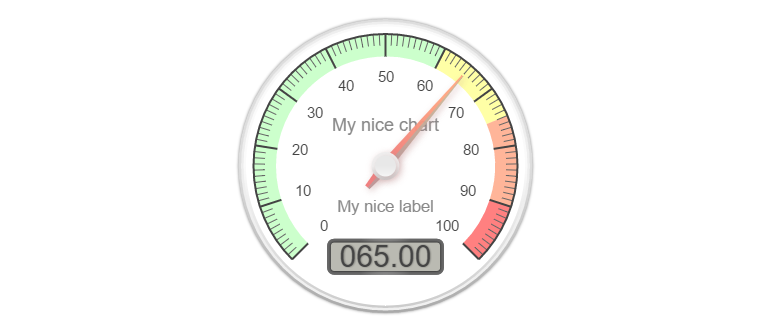
### Gauge
Note: You either need 1 value or 3 following this standar: ```[actualValue, minValue, maxValue]```
```php
Charts::create('gauge', 'canvas-gauges')
->setTitle('My nice chart')
->setElementLabel('My nice label')
->setValues([65,0,100])
->setResponsive(false)
->setHeight(300)
->setWidth(0);
```
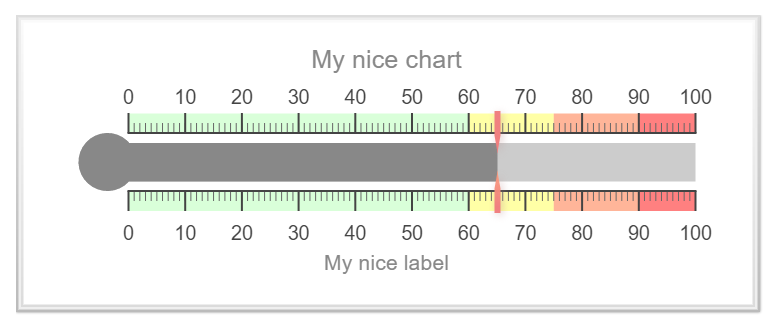
### Temperature
Note: You either need 1 value or 3 following this standar: ```[actualValue, minValue, maxValue]```
```php
Charts::create('temp', 'canvas-gauges')
->setTitle('My nice chart')
->setElementLabel('My nice label')
->setValues([65,0,100])
->setResponsive(false)
->setHeight(300)
->setWidth(0);
```
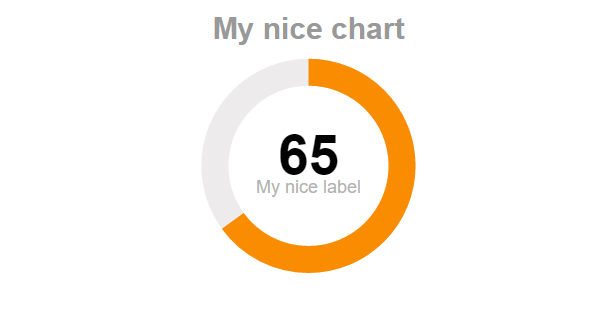
### Percentage
Note: You either need 1 value or 3 following this standar: ```[actualValue, minValue, maxValue]```
```php
Charts::create('percentage', 'justgage')
->setTitle('My nice chart')
->setElementLabel('My nice label')
->setValues([65,0,100])
->setResponsive(false)
->setHeight(300)
->setWidth(0);
```
### Progressbar
Note: You either need 1 value or 3 following this standar: ```[actualValue, minValue, maxValue]```
```php
Charts::create('progressbar', 'progressbarjs')
->setValues([65,0,100])
->setResponsive(false)
->setHeight(50)
->setWidth(0);
```

## Extend your way!
You can create your own Charts by forking this repository. The ```src/Templates``` folder contains all the current charts, but you can
add yours like this:
### Create a new file
Create a new file, the syntax is: ```library.type.php```
if your chart library is called: ```mylib```
and your template is for the line chart: ```line```
Then you create a file like this: ```mylib.line.php```
To call it later, just use:
```php
$chart = Charts::create('line', 'mylib');
You will need to add the CSS / JS to the includes.php file found in the /src folder., (*9)
You have plenty of examples to see how to put the data so just take a closer look at all the included templates before doing yours!, (*10)
 Wallogit.com
