 Wallogit.com
2017 © Pedro Peláez
Wallogit.com
2017 © Pedro Peláez
library sql-charts-dashboard
Simple PHP library for create SQL charts dashboard

fbohorquez/sql-charts-dashboard
Simple PHP library for create SQL charts dashboard
- Friday, July 6, 2018
- by fbohorquez
- Repository
- 1 Watchers
- 2 Stars
- 1 Installations
- PHP
- 0 Dependents
- 0 Suggesters
- 0 Forks
- 0 Open issues
- 1 Versions
- 0 % Grown
The README.md
![]() , (*1)
, (*1)
sql-charts-dashboard
Simple PHP library for create SQL charts dashboard, (*2)
Requirements
Installation
You can use Composer or simply Download the Release, (*3)
Composer
The preferred method is via composer. Follow the installation instructions if you do not already have composer installed., (*4)
Once composer is installed, execute the following command in your project root to install this library:, (*5)
composer require fbohorquez/sql-charts-dashboard
Finally, be sure to include the autoloader:, (*6)
require_once '/path/to/your-project/vendor/autoload.php';
Download the Release
If you abhor using composer, you can download the package in its entirety. The Releases page lists all stable versions. Download any file
with the name sql-charts-dashboard-[RELEASE_NAME].zip for a package including this library and its dependencies., (*7)
Uncompress the zip file you download, and include the autoloader in your project:, (*8)
require_once '/path/to/sql-charts-dashboard/vendor/autoload.php';
Using SQL Charts Dashboard Library
Connection
Connection object is a connection to database system. The Connections are used by Query to access the data., (*9)
A Connection object has:, (*10)
- database name
- user
- pass
- host
- engine
$c = new Connection ('database', 'user', 'pass', 'localhost', 'mysqli');
Today library has support for mysqli and pdo_mysql modules. You can build yours class SQL engine implementing this interface, (*11)
Also you can defined a default SQL engine to all connections in a dashboard., (*12)
Dashboard::setDefaultSqlEngine ('pdomysql');
$c = new Connection ('database', 'user', 'pass', 'localhost');
mysqli is init default SQL engine., (*13)
Query
Query object is a SQL query. This is a SQL string and a connection to database system. Queries only call database one time, these cache results., (*14)
$c = new Connection ('database', 'user', 'pass', 'localhost');
$query = new Query ('SELECT state, COUNT(*) as n FROM offers GROUP BY state', $c);
You can defined a default Connection to all queries in a dashboard., (*15)
Dashboard::setDefaultConnection ('database', 'user', 'pass', 'localhost');
$query = new Query ('SELECT state, COUNT(*) as n FROM offers GROUP BY state');

//or

$c = new Connection ('database', 'user', 'pass', 'localhost');
Dashboard::setDefaultConnection ($c);
$query = new Query ('SELECT state, COUNT(*) as n FROM offers GROUP BY state');
Charts
Charts objects represent graphics that draw in client side. There severals types of charts: line, table, pie, area... You must take class corresponding to type of chart. A Chart has a title, Query and a columns defination., (*16)
$query = new Query ('SELECT state, COUNT(*) as n FROM offers GROUP BY state');
$chart = new ChartLine (
  'line-chart-example',
  $query,
  [
    'state' => [
        'type' => 'string',
        'label' => 'State',
    ],
    'n' => [
      'type' => 'number',
      'label' => 'Amount',
    ],
  ]
);
Keys of columns defination array must be fields in SQL query., (*17)
Default charts engine in client side is google chart (gchart). Optionally you can construct charts with a distinct engine as last parameter in constructor., (*18)
Today library has support only for google charts. You can build yours class charts engine implementing this interface, (*19)
You can defined a default charts engine to all charts in a dashboard., (*20)
Dashboard::setDefaultChartsEngine ('gcharts');
Also you can set options to chart object. Options depends of chart engine., (*21)
$chart->setOptions (
  [
    'colors' => ['red'],
  ]
);
Also you can set a new query to chart., (*22)
$chart->setQuery ($query);
Dashboard
Dashboard object represent charts set. This has a title and chart object or charts objects array. Dashboard object has method html that return HTML string for response., (*23)
$dash = new Dashboard ('dashboard-example', $chart);
echo $dash->html();

//or

$dash = new Dashboard ('dashboard-example', [$chart0, $chart1, $chart2]);
echo $dash->html();
HTML is generated with simple view engine. This use concatenate strings for generate a clean struct HTML that contain charts. You can build your view engine implementing this interface. Optionally you can construct dashboards with a distinct view engine as last parameter in constructor. Also you can defined a default view engine to all dashboards., (*24)
Dashboard::setDefaultViewEngine ('simple');
You can add new charts to dasboard., (*25)
$dashboard->addChart (
  (
    new ChartBar (
      'bar-chart-example',
      $query,
      [
        'state' => [
            'type' => 'string',
            'label' => 'State',
        ],
        'n' => [
          'type' => 'number',
          'label' => 'Amount',
        ],
      ]
    )
  )
);
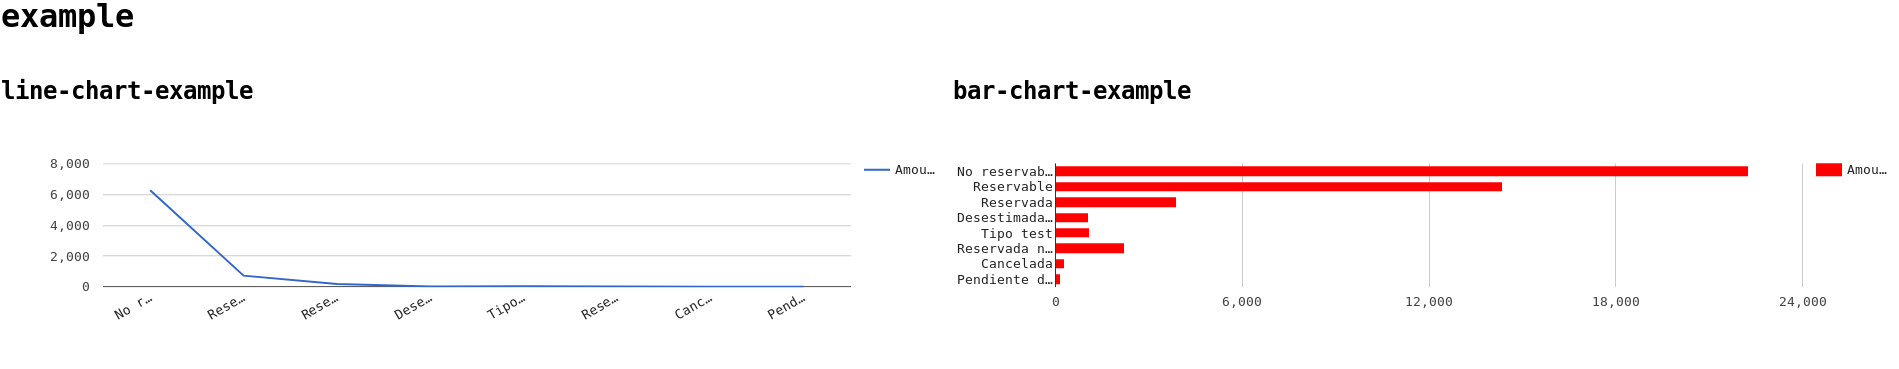
Example
use SqlChartsDashboard\Dashboard;
use SqlChartsDashboard\Query;
use SqlChartsDashboard\ChartType\ChartLine;
use SqlChartsDashboard\ChartType\ChartBar;

Dashboard::setDefaultConnection ('database', 'user', 'pass', 'localhost');

$query = new Query ('SELECT state, COUNT(*) as n, MAX(pvp) as pvp FROM offers GROUP BY state');

echo (
    new Dashboard (
      'example',
      [
        ( // chart0
          new ChartLine (
            'line-chart-example',
            $query,
            [
              'state' => [
                  'type' => 'string',
                  'label' => 'State',
              ],
              'n' => [
                'type' => 'number',
                'label' => 'Amount',
              ],
            ]
          )
        ),
        ( // chart1
          (new ChartBar ('bar-chart-example'))
          ->setQuery ($query)
          ->setColumns (
            [
              'state' => [
                  'type' => 'string',
                  'label' => 'State',
              ],
              'pvp' => [
                'type' => 'number',
                'label' => 'Max PVP',
              ],
            ]
          )
          ->setOptions (
            [
              'colors' => ['red'],
            ]
          )
        )

      ]
    )
)->html();
 , (*26)
Autor
Francisco Javier Bohórquez Ogalla, (*27)
Developed with ♥ by dev2bit, (*28)